
ROOT-SERVER TUTORIAL
Installing Prometheus and Grafana


Introduction
In this tutorial, you will learn how to install Prometheus and Grafana to collect data from your servers using Node Exporter.
Prometheus Node Exporter provides hardware and OS metrics of the host system.
Prometheus is the database where all the metrics are stored. It is also the software that collects the metrics provided by the exporters over HTTP.
Grafana visualizes the collected data. It is basically the frontend for the Prometheus database, but supports many other databases as well.
Requirements
- Minimum of 2 Debian-based servers with root / sudo access (Ubuntu works too)
Step 1 - Install Node Exporter on all servers
Node Exporter collects the system data and provides it in a format that Prometheus can read. This exporter should be installed on all hosts. There are two ways to install the Node Exporter:
- Through the package manager:
With this method, you will most likely not install the latest available version of Node Exporter, but this should be sufficient for most setups.
sudo apt-get update
sudo apt-get install -y prometheus-node-exporter
- Through binary download (newest version):
With this method, you can install any version you want, including the latest version with the latest features and bugfixes.
All available versions can be found on the release page: https://github.com/prometheus/node_exporter/releases
wget https://github.com/prometheus/node_exporter/releases/download/v1.2.2/node_exporter-1.2.2.linux-amd64.tar.gz
tar xf node_exporter-1.2.2.linux-amd64.tar.gz
cd node_exporter-1.2.2.linux-amd64
./node_exporter &
Step 2 - Set up Prometheus on the "metrics" server
Prometheus pulls the metrics from the Node Exporter and stores the data in its database.
sudo apt-get install -y prometheus
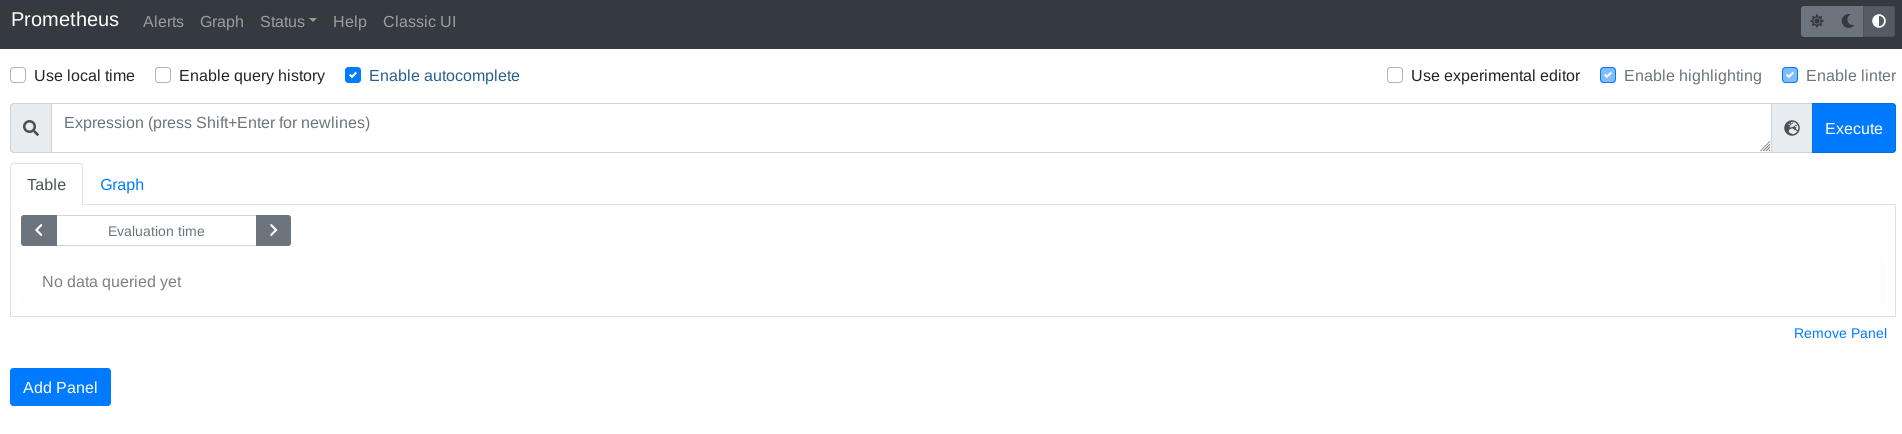
Check if Prometheus was installed successfully by opening the server IP followed by port 9090 in your browser:
Now the Node Exporter targets must be configured in the Prometheus server. The configuration is stored in /etc/prometheus/prometheus.yml.
Add the following "job_name" to your "scrape_configs" and replace "ip-of-other-server" with the IP address of your second server:
scrape_configs:
  - job_name: "node_exporter"
    metrics_path: "/metrics"
    static_configs:
      - targets:
          - "localhost:9100"
          - "ip-of-other-server:9100"
If you have more servers, just add them to the "Targets" list one by one. To apply the configuration changes, the Prometheus service must be restarted.
sudo systemctl restart prometheus.service
Use systemctl to check the status of the service.
sudo systemctl status prometheus.service
Prometheus now automatically scrapes Node Exporter endpoints periodically on all configured targets and stores the metrics in its database.
Step 3 - Install Grafana on the "metrics" server
Grafana is used to visualize the metrics collected and stored by the Prometheus service.
First you need to add the external Grafana apt repository:
sudo apt-get install -y apt-transport-https
sudo apt-get install -y software-properties-common wget
wget -q -O - https://packages.grafana.com/gpg.key | sudo apt-key add -
echo "deb https://packages.grafana.com/oss/deb stable main" | sudo tee -a /etc/apt/sources.list.d/grafana.list
Then you can install Grafana itself:
sudo apt-get update
sudo apt-get install -y grafana
Use systemctl to check the status of the service.
sudo systemctl status grafana-server.service
Step 4 - Configure Prometheus as data source in Grafana
Grafana can easily be configured through a web interface. It is reachable on port 3000 with the following default credentials:
Username: admin
Password: admin
After the first login you are forced to change the password. Make sure to pick a strong password.
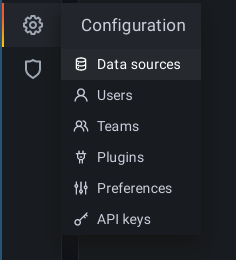
To configure Prometheus as a metrics data source, click on the settings on the left side and select "Data sources":
Then select "Prometheus" as "Time series databases":
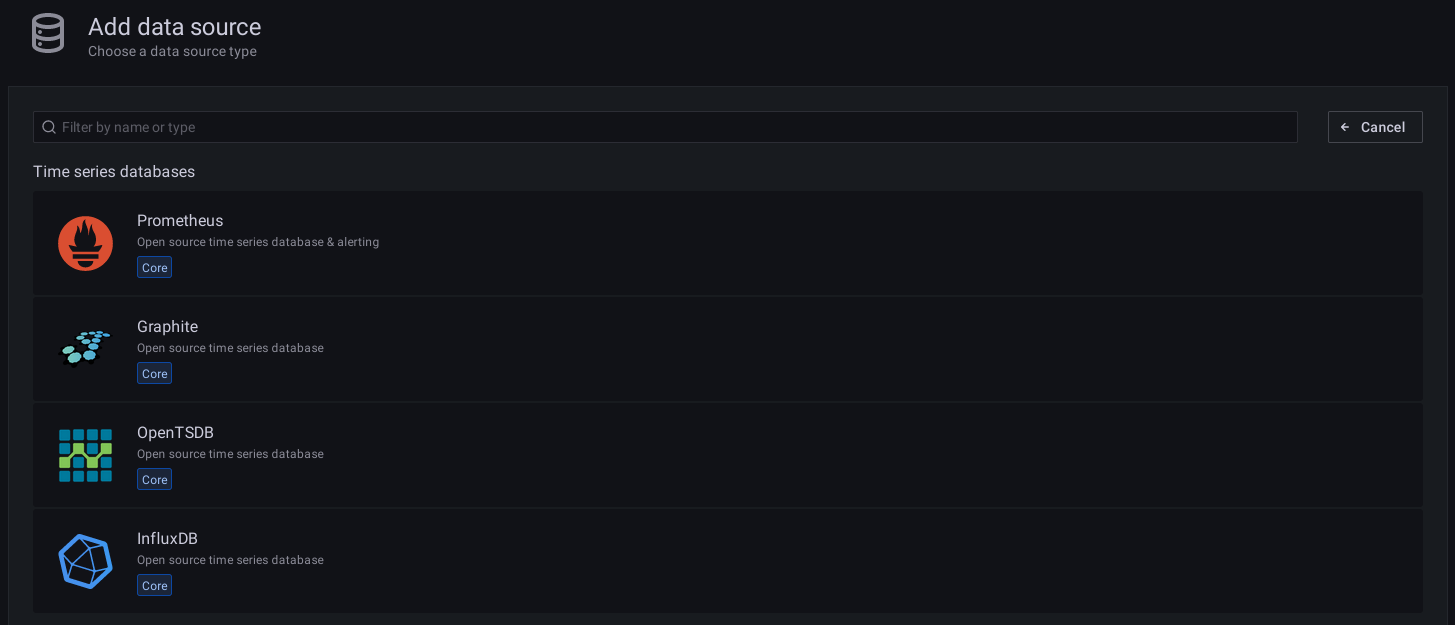
Now you can enter "http://localhost:9090" as URL and save the data source.
Step 5 - Add a dashboard in Grafana
The community publishes a lot of dashboards on grafana.com: https://grafana.com/grafana/dashboards/?search=node+exporter&dataSource=prometheus
For example, pick the Node Exporter Full dashboard and copy the ID on the left side. To import the dashboard, switch back to your Grafana installation and select "Import" after hovering on the "+" on the left side:
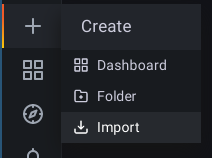
Paste the ID you just copied, click the "Load" button and then finally import your dashboard.
After the successful import, the dashboards display the metrics stored in your Prometheus database.
Conclusion
By following the instructions in this tutorial, you have installed the Prometheus Node Exporter on two servers that provide metrics collected by the Prometheus installation. Grafana visualizes the data collected from your two servers. If you need more data from different applications, you can expand this setup in the future with new exporters and dashboards.
License
Permission is hereby granted, free of charge, to any person obtaining a copy of this software and associated documentation files (the "Software"), to deal in the Software without restriction, including without limitation the rights to use, copy, modify, merge, publish, distribute, sublicence, and/or sell copies of the Software, and to permit persons to whom the Software is furnished to do so, subject to the following conditions:
The above copyright notice and this permission notice shall be included in all copies or substantial portions of the Software.
THE SOFTWARE IS PROVIDED "AS IS", WITHOUT WARRANTY OF ANY KIND, EXPRESS OR IMPLIED, INCLUDING BUT NOT LIMITED TO THE WARRANTIES OF MERCHANTABILITY, FITNESS FOR A PARTICULAR PURPOSE AND NONINFRINGEMENT. IN NO EVENT SHALL THE AUTHORS OR COPYRIGHT HOLDERS BE LIABLE FOR ANY CLAIM, DAMAGES OR OTHER LIABILITY, WHETHER IN AN ACTION OF CONTRACT, TORT OR OTHERWISE, ARISING FROM, OUT OF OR IN CONNECTION WITH THE SOFTWARE OR THE USE OR OTHER DEALINGS IN THE SOFTWARE.
Contributor's Certificate of Origin
By making a contribution to this project, I certify that:
-
The contribution was created in whole or in part by me and I have the right to submit it under the license indicated in the file; or
-
The contribution is based upon previous work that, to the best of my knowledge, is covered under an appropriate license and I have the right under that license to submit that work with modifications, whether created in whole or in part by me, under the same license (unless I am permitted to submit under a different license), as indicated in the file; or
-
The contribution was provided directly to me by some other person who certified (a), (b) or (c) and I have not modified it.
-
I understand and agree that this project and the contribution are public and that a record of the contribution (including all personal information I submit with it, including my sign-off) is maintained indefinitely and may be redistributed consistent with this project or the license(s) involved.